
OpenTelemetry changes its security policy. Your upgrade checks need to change too.
A telemetry upgrade can preserve every public API and still change which data reaches your dashboard. OpenTelemetry’s new policy makes that distinction explicit—and gives operators a reason to test the evidence path.
Published 23 October 2026. Independent news analysis; source announcements are dated in the article.
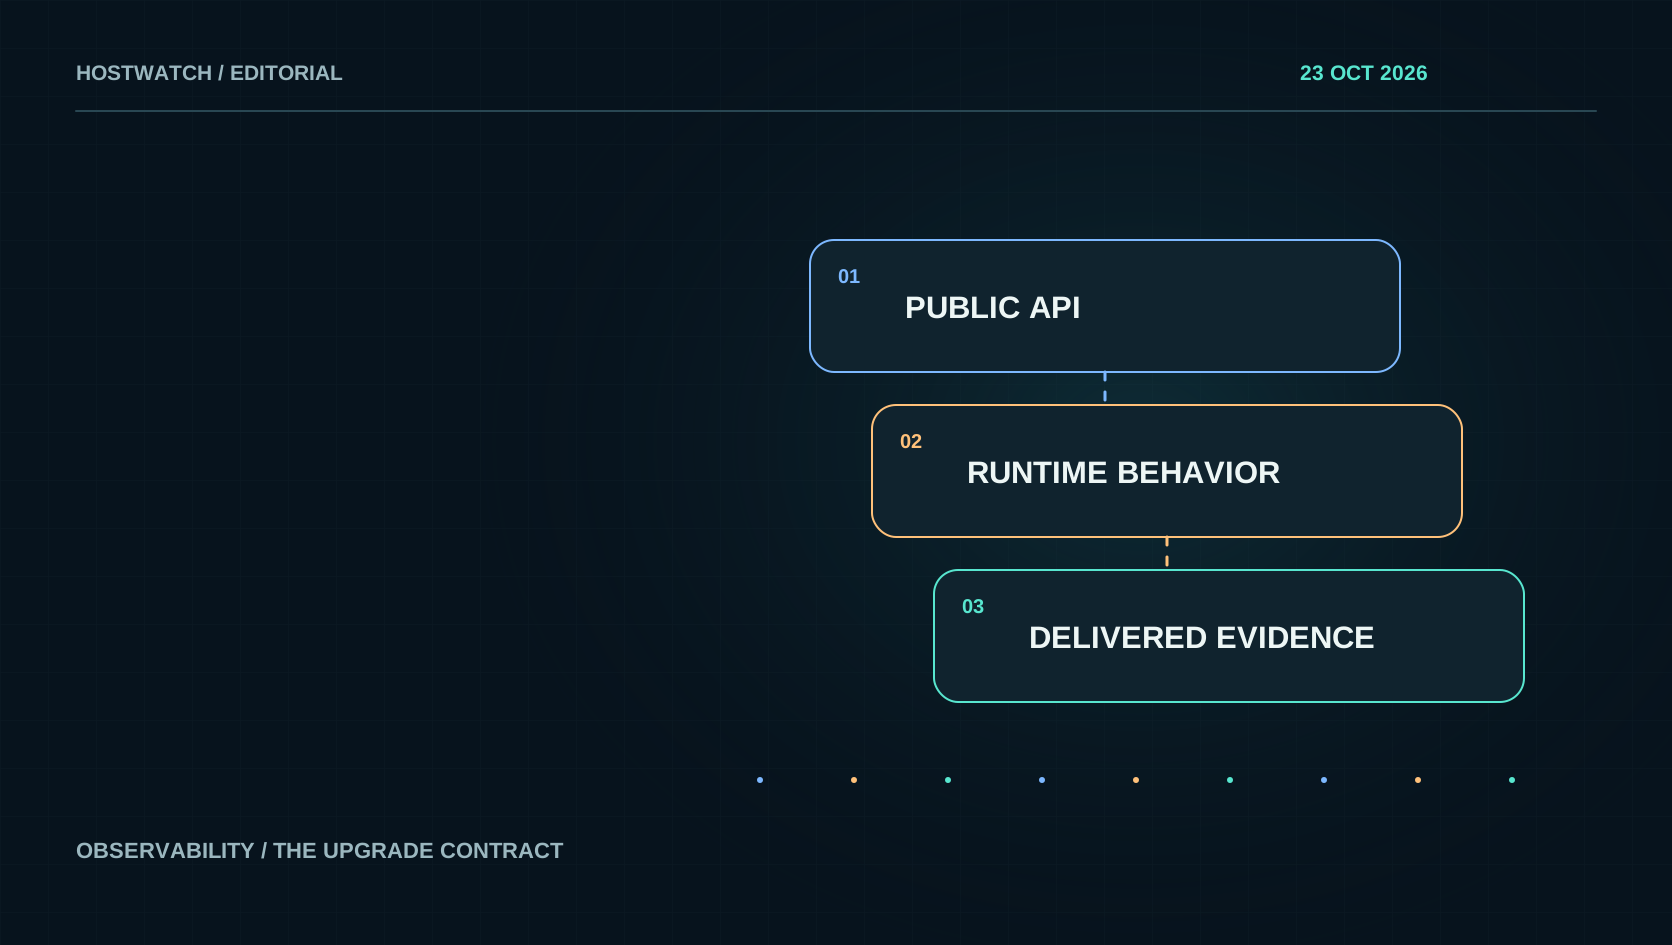
What OpenTelemetry announced on 22 October
OpenTelemetry has revised its client versioning policy to permit necessary, narrowly scoped security changes to behavior or configuration in minor and patch releases of stable SDKs and Contrib components. Public API compatibility remains protected. The project says release notes must explain operational impact and required migration steps when applicable. This is a policy change, not an announcement that every OpenTelemetry deployment is vulnerable or that every patch changes behavior. The distinction is set out in the project’s announcement and the linked specification change.
Our operational reading is straightforward: a successful build cannot be the only acceptance test for a telemetry upgrade. Application code may compile while a collector, exporter or instrumentation component handles a particular input differently. That difference can be the intended protection. The operator still needs to know whether the resulting dashboard describes fewer real events, fewer malformed events, a delayed stream or a broken transport. The rest of this article is our analysis of how to establish that distinction; it is not a claim that the upstream policy mandates a particular monitoring architecture.
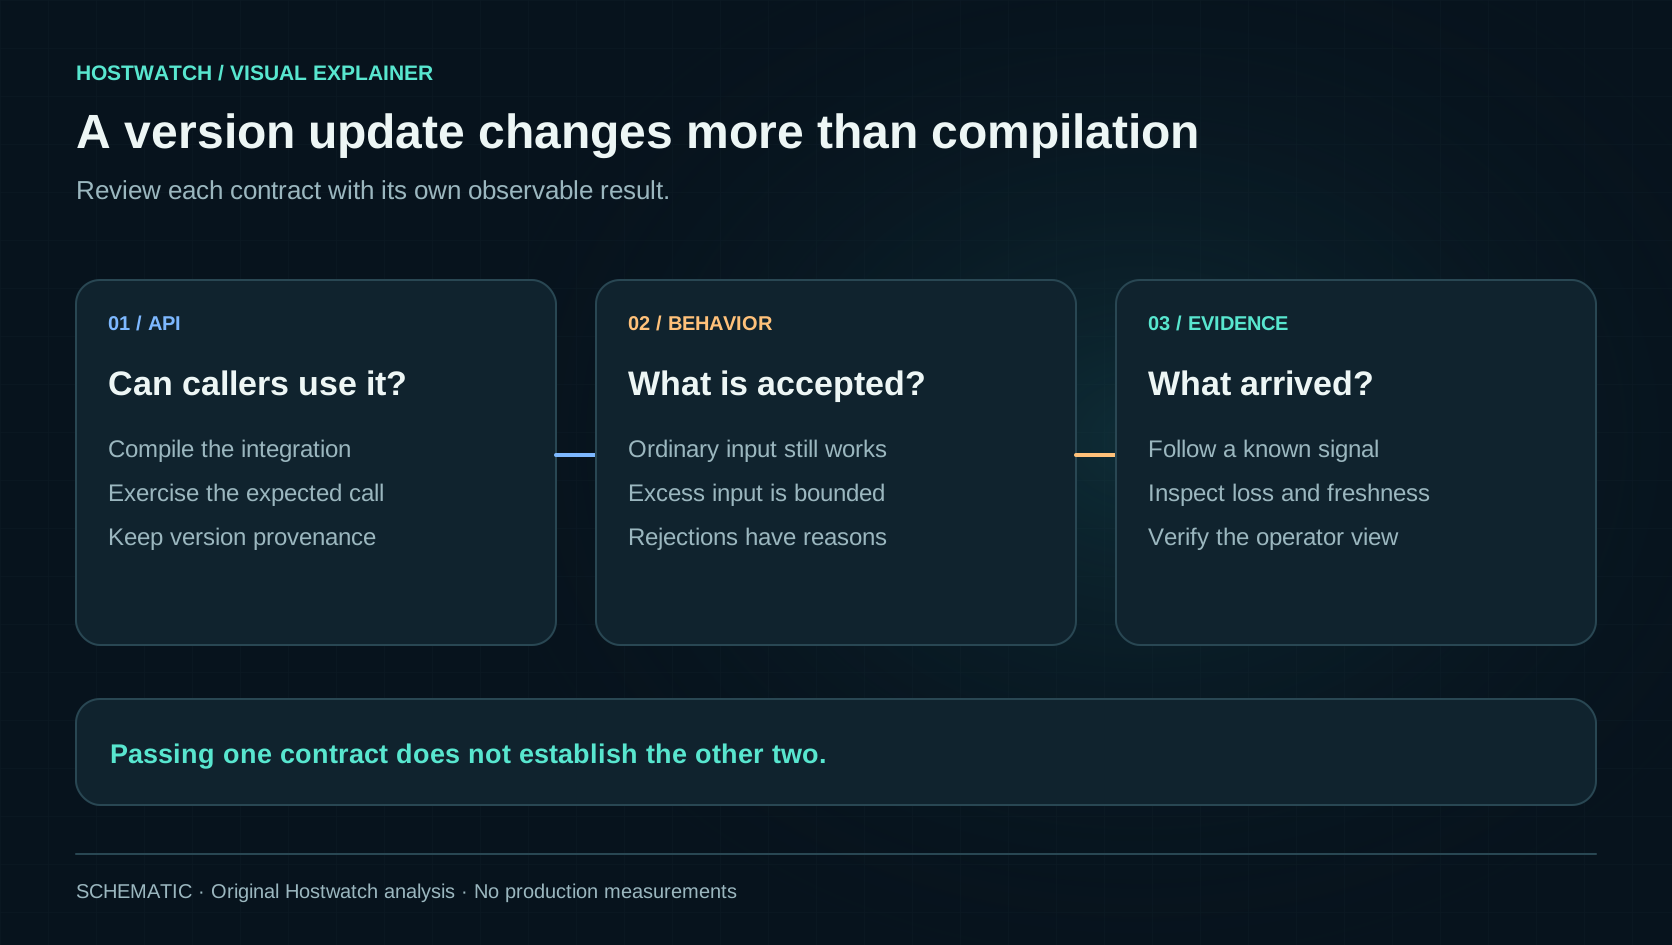
Test three contracts, not one version number
For an upgrade review, write down three contracts. The API contract describes what the application can call. The behavior contract describes what the running component accepts, rejects, transforms or limits. The evidence contract describes what the person investigating an incident can actually retrieve. A unit test that constructs an exporter may cover the first contract. A controlled request carrying an unusual attribute may exercise the second. Following that request through ingestion, storage and the dashboard exercises the third. These checks overlap, but none can stand in for the entire journey.
Make each contract concrete before changing a deployment. Identify one ordinary transaction that must remain observable, one deliberately invalid or excessive input that should be contained, and one unavailable-backend scenario. Record the expected result at each boundary. If the invalid input is rejected without consuming unbounded memory, that is useful protection. If the ordinary transaction disappears too, the rollout needs investigation. If the backend is unavailable, the application should have a bounded failure path whose lost or delayed signals are visible. A release label alone cannot tell those outcomes apart.
A quieter dashboard needs an explanation
Imagine an error chart falling immediately after a telemetry deployment. There are several plausible explanations: the application recovered, the observation window changed, the exporter fell behind, or a new input boundary discarded events. This is an illustrative incident, not a measurement from OpenTelemetry or Hostwatch. The point is that the same line shape supports incompatible conclusions. A trustworthy interface should show the producer’s last successful sample, the collector’s last successful delivery and any available rejection or loss counters beside the chart. When those measurements do not exist, display missing coverage rather than manufacture certainty.
Treat rejection as its own outcome. A deliberately contained telemetry payload is not automatically an application failure, and a dropped observation is not automatically a successful security control. Preserve the reason supplied by the component and the scope it describes. A per-batch rejection must not silently become a count of distinct customers. A bounded sample list must not become the denominator for the full day. These distinctions become especially important when incident automation consumes the same dashboard: reduced visibility should not look like verified recovery and trigger a premature resolution.
Canary the pipeline with bounded, recognizable traffic
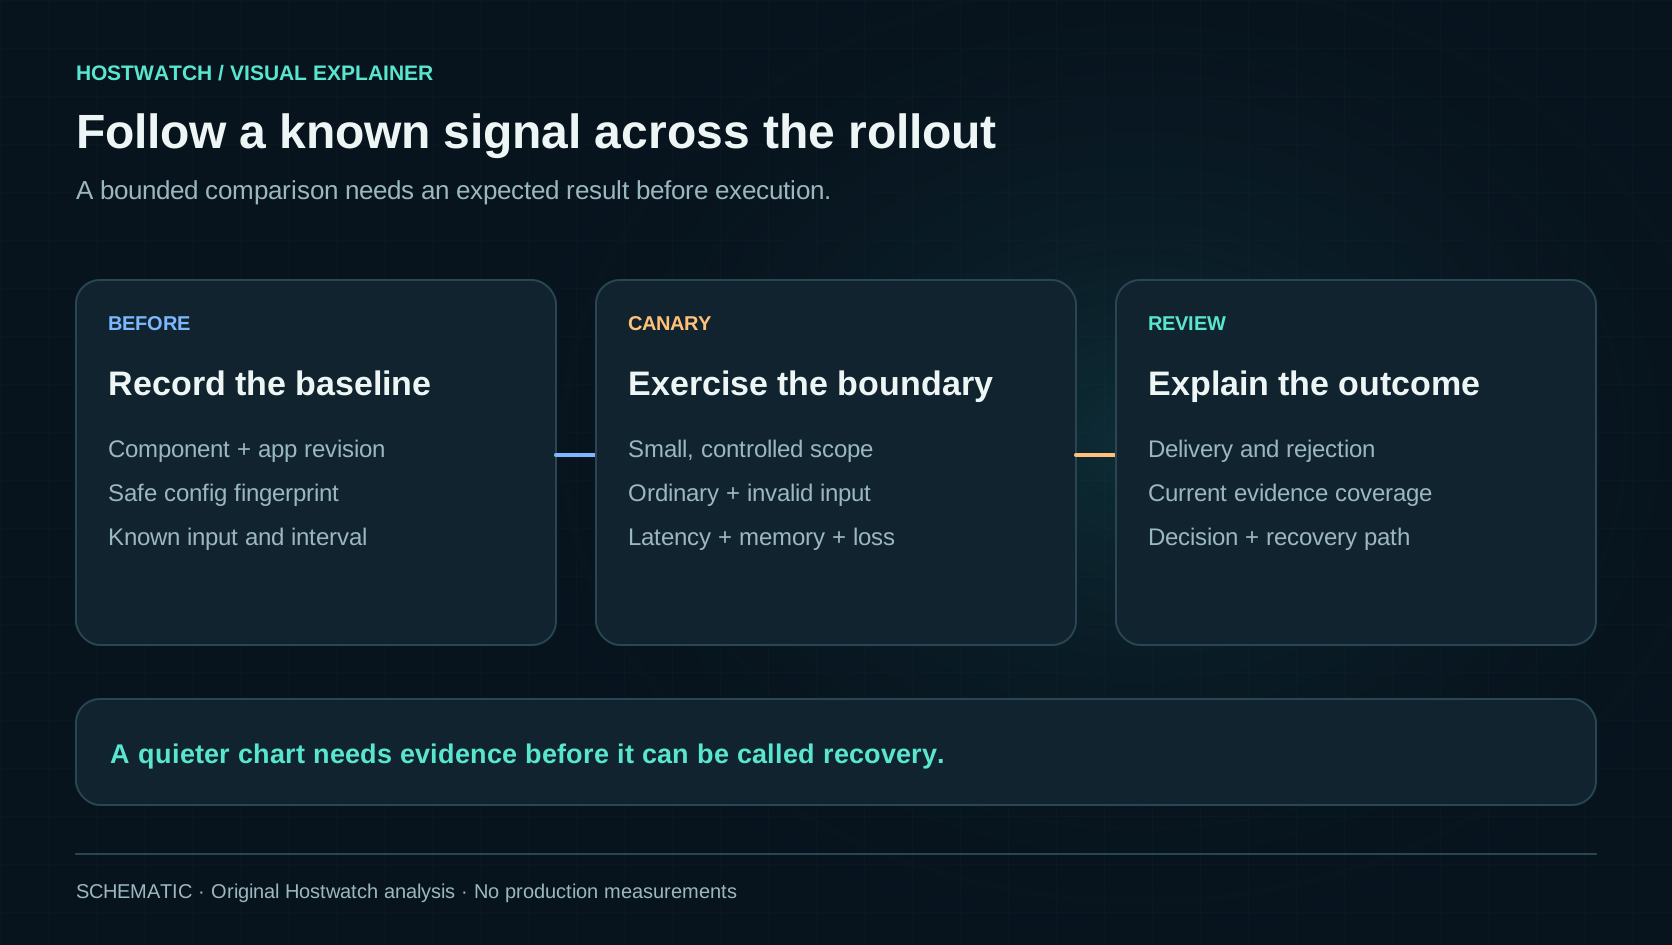
A useful canary has a small set of recognizable operations and a narrow deployment scope. Record the application revision, telemetry component revision, configuration digest and the observation window. Send an ordinary request and confirm that its expected signal reaches the intended destination. Then use a disposable test input to exercise the boundary being changed. Keep that input away from production customer data and cap its size and repetition. The goal is to discover a semantic difference, not to stress the entire service until unrelated limits dominate the experiment.
Compare the canary with a baseline that answers the same question over the same interval. Watch application latency and memory alongside telemetry outcomes; a healthy exporter is not enough if instrumentation disrupts requests. Record startup, backend interruption and recovery as separate moments. Avoid keeping a second full production export path indefinitely just to feel safe: duplicated streams create their own costs and counting problems. For a short comparison, identify which stream each observation belongs to and how it will be removed. Retain enough evidence to explain the rollout after temporary instrumentation is gone.
Review the deployed configuration, including overrides
A repository configuration is only one part of the running system. An environment variable, command-line option, injected chart value or generated file can change the effective behavior. During an upgrade, compare the settings actually loaded by the component with the intended settings. Record safe configuration names and digests rather than copying credentials into a ticket. If a setting was renamed or its accepted values changed, an application that starts successfully may still be using a fallback. Startup diagnostics and a targeted behavior check are stronger evidence than finding the old text in Git.
Give the telemetry path a resource budget of its own. Decide how much buffering is acceptable, how long a backlog may persist and what happens when that budget is exhausted. Those are operating choices, not claims about a universal OpenTelemetry default. A small API server and a batch worker may need different tradeoffs. Make the policy visible to whoever maintains alerts: if the system intentionally sacrifices some diagnostic detail to protect request handling, the dashboard must explain that loss. Otherwise the protection merely moves the incident into an invisible part of the stack.
Define rollback without erasing a security decision
A rollback plan should identify what is reversible and what evidence warrants the decision. Returning to a previous image can restore compatibility while also restoring the behavior the security update changed. That may be an unacceptable long-term state. Before rollout, identify any narrowly scoped temporary accommodation and who can authorize it. Keep its duration and removal condition explicit. If the problem is a configuration mistake or an unsupported integration, repair that cause instead of treating a broad rollback as the final fix. A calm chart after reverting does not prove that the system is safe.
Finish the change record with observed results: which ordinary signals arrived, which boundary checks behaved as intended, what resource impact was measured and what remains unknown. Link release notes to the deployed revision and the canary window. A future operator should be able to distinguish “the application produced no errors” from “this collector stopped accepting that class of signal.” OpenTelemetry’s announcement is a useful prompt for that discipline. The practical work is establishing a dependable observation contract across the system you actually run, rather than treating compatibility as a single green check in a dependency update.
Treat an observability update as a change to the evidence pipeline: verify accepted input, rejected input, delivery, resource cost and the explanation an operator sees when coverage changes.