
A million requests, forty examples: building traffic history you can trust
Counters, five-minute summaries and individual requests answer different questions. Here is how to reconcile them before a chart becomes a security decision.

The numbers look wrong because they describe different things
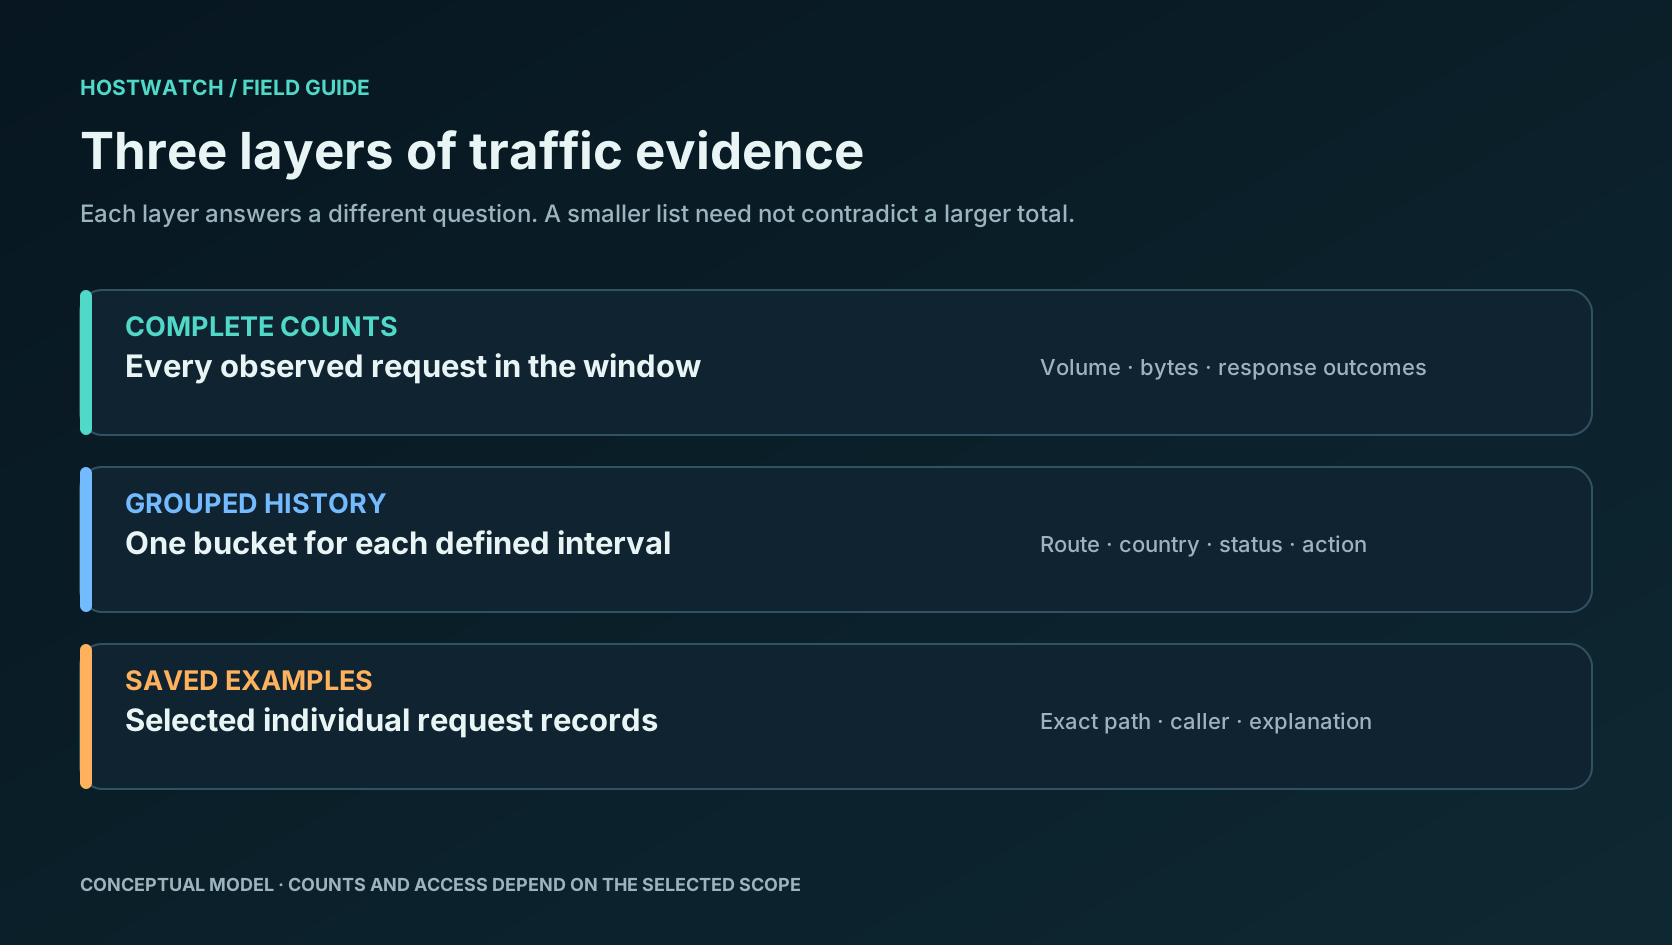
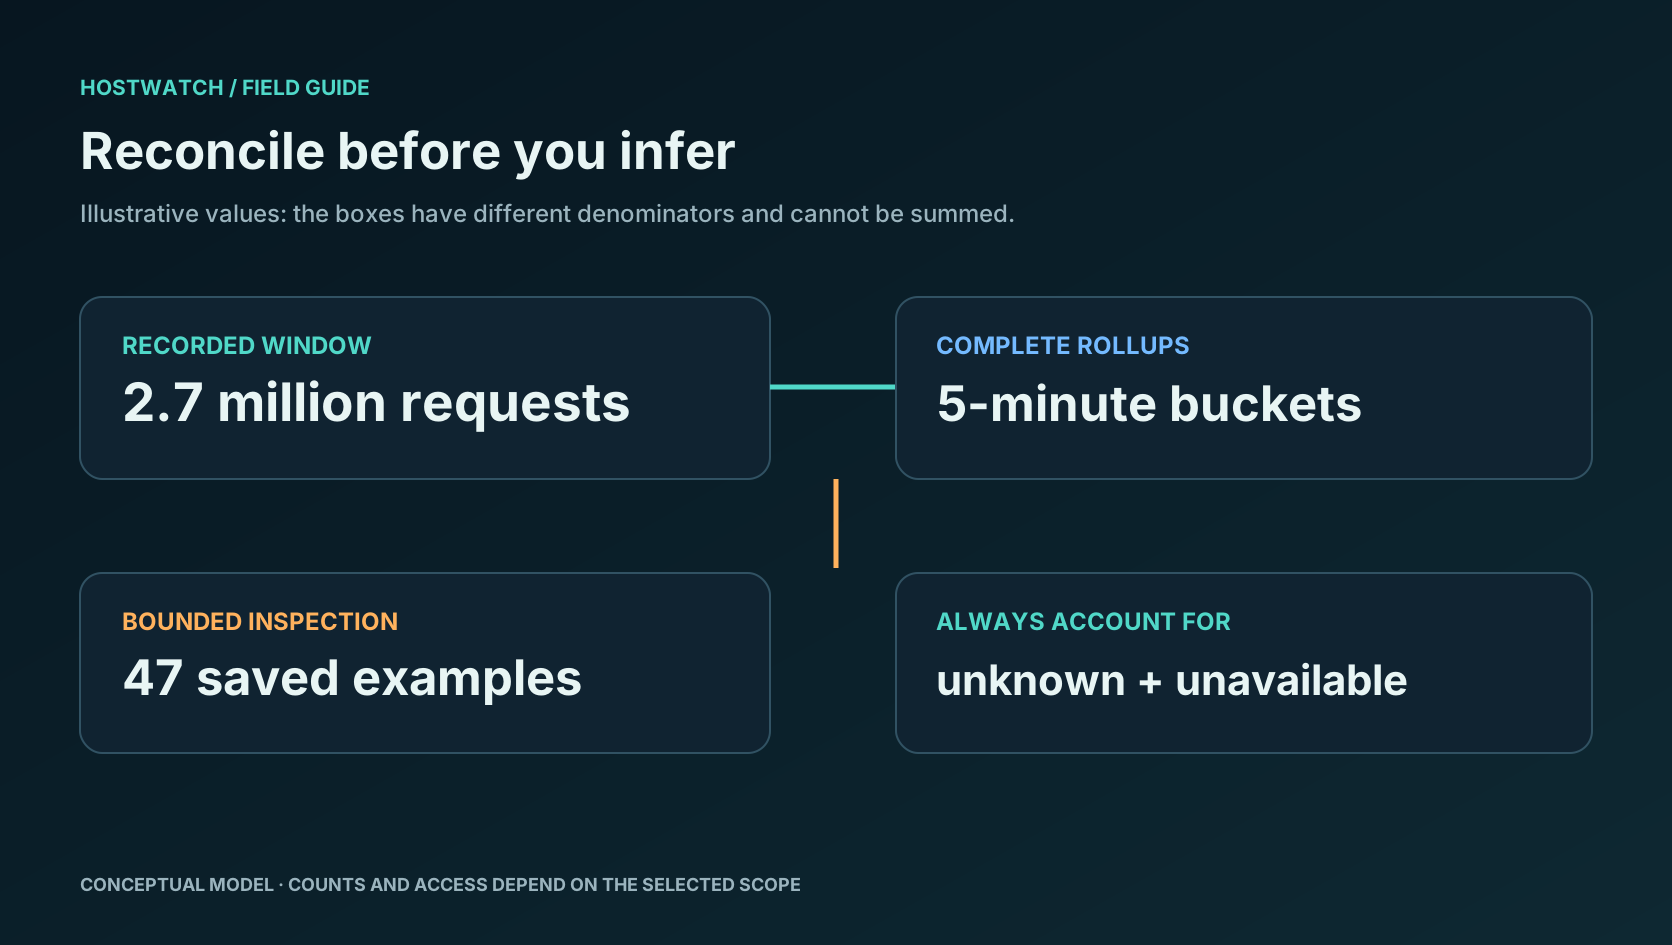
An operator opens a project and sees 2.7 million requests in the selected window. The destination list contains forty-seven rows; a map has a few dozen points; a query chart shows only a handful of variants. It is tempting to conclude that the counter is inflated. Sometimes a counter really is duplicated, and that possibility deserves a test. Often the less dramatic explanation is that the large number came from a complete request counter while the smaller screens came from a bounded set of saved examples. The labels must make this difference impossible to miss. A polished chart without its denominator is a persuasive way to tell an incorrect story.
Begin with a reconciliation sheet: exact start and end time, site or host, request source, aggregation interval, filters, number of records represented, and the time each dataset was last updated. Ask whether the request total counts Nginx entries, unique clients, unique URLs, application transactions or completed responses. Those quantities are not interchangeable. A browser visit can issue dozens of HTTP requests. A retry creates another request. A proxy may produce one upstream call for many clients when it serves a cached response. Only after the scopes match should the team investigate lost events or double counting. This discipline is also a product design requirement: each visual should disclose what it actually measured.
Raw events are the audit trail, not the dashboard query plan
A useful request event records a timestamp, normalized site, route, response outcome, transfer size, trusted client identity when available, and a provenance marker for the layer that observed it. Detection and enforcement metadata belong alongside the event only when a rule or decision can actually be attributed. A 429 response, for example, is a response code; it is not automatically a verified Hostwatch mitigation. The event schema should separate an observed HTTP status from a rule match, an installed generation and the action that produced it. Otherwise retrospective analysis will count ordinary application 429s as successful blocks.
Column stores such as ClickHouse are a natural fit for scanning large, append-heavy request histories by time and dimension. A short raw-event retention window can control disk growth while leaving enough time to investigate incidents. TTL is not an instantaneous deletion switch: background work removes expired parts or rows according to the engine's merge behavior. Plan disk capacity for that lag and monitor actual occupied bytes, oldest retained timestamp, ingest delay and failed writes. Keep query access narrow. Giving every dashboard client permission to scan all raw events can turn an observability feature into a new load generator at precisely the moment the origin is already stressed.

Five-minute summaries should preserve the questions operators ask
A five-minute rollup trades individual request detail for dependable historical queries. Choose dimensions deliberately: site, route family, status class, detection category, verified action, country when known, and perhaps a bounded provider classification. Sum requests and bytes; keep latency distributions in a mergeable form rather than averaging averages. Store the bucket start in UTC and make retries idempotent. If an aggregation job runs twice, the dashboard must not double the totals. One approach replaces a bucket by a stable key and version after validating its raw input range. Another uses a ledger or checkpoint and carefully handles replay. The implementation details vary; the invariant is that each source event contributes once to the selected historical answer.
MongoDB can serve a separate collection of compact rollup documents when application queries and sharing controls favor document access. It should not become an unbounded duplicate of every request merely because documents are convenient. Decide what each store owns: short-lived detailed events, durable rollups, policy state, and a small recent inspection buffer. Record aggregation lag and bucket completeness. A bucket that is still arriving is provisional; the interface can show a live value beside a last-complete five-minute value. If the current and historical paths overlap, reconcile their boundary explicitly so a minute is neither omitted nor counted twice.

Saved examples remain useful when they are named honestly
Individual request examples answer a different question: what exact path did this client ask for, what did the response say, and which evidence explains a detector finding? They are ideal for a detail drawer and a short incident review. A ring buffer of the most recent 200 events is not a distribution of a full day. At a million requests, it can represent a tiny and heavily recent-biased sliver. Rendering its most common countries as a map of all visitors would be mathematically false. If the interface cannot calculate full-window geography, label the map “saved examples,” show the denominator, and let users inspect the records rather than pretending the estimate is complete.
Different kinds of examples may deserve different retention. Random samples help assess ordinary traffic; explicitly preserved events around a detector transition explain a security action; a short trace around a 502 helps debug an upstream. Bound each category by size and time, and redact secrets before storage. Query strings may contain tokens or personal data. A drill-down should say whether it opened a complete aggregate or a few illustrative rows. For IP analysis, keep durable counters or compact suspicion histories only with a clear retention and access policy. A broad, permanent list of every visited URL per person is harder to secure and usually unnecessary for deciding whether a temporary route policy worked.
Country, caller and route need stable definitions
A country map depends on an address and on the point in time when that address was mapped. If a proxy chain is trusted incorrectly, a client can supply a forged forwarding header and appear to come from anywhere. Define the trusted proxy boundary first, then derive client IP. Preserve an “unknown” category for events that lack trustworthy geography. City attribution is less precise than country attribution and can change with database updates or shared networks. A city chart built only from saved examples must not inherit the full-window country total. The two can coexist, but the subtitle and tooltip need to state their different evidence coverage.
Routes also need normalization. A single parameterized application route can produce countless concrete URLs. For security analysis, distinguish the route template from an exact path and from a canonical query shape. Preserve raw values only when necessary for a bounded investigation. Grouping every unique query string into its own bucket creates huge cardinality and hides the fact that one endpoint is under pressure. Grouping every path under the site hides the hotspot. The right hierarchy lets the operator move from site to route family to safe examples, while the totals at each step add up within the same selected window and filter.
Caching can absorb repetition without giving attackers the key space
A repeated read-only page is a sensible cache candidate, but a blanket rule to cache every URL is dangerous. An adversary can vary query parameters indefinitely and force new keys, consuming memory while each request still reaches the origin. Define a route allowlist and a canonical cache key using only parameters that change the public response. Reject or ignore irrelevant parameters at the edge where the application semantics allow it. Never cache private pages, authorization-dependent responses, unreviewed cookies or user-specific results under a shared key. Use a strict memory budget, maximum object size, admission threshold, short freshness period and explicit invalidation for mutable content.
A Redis cache can serve a hot public route quickly, but it is another finite resource. Protect it with a bounded key count, an eviction policy suited to the workload, connection limits, timeout budgets and circuit breaking. A useful admission rule waits until a canonical route receives repeated demand before allocating an object. Refreshing a time-to-live on every hit may keep popular pages resident, but it can also pin content indefinitely and conceal staleness. Cap the absolute age and observe hit rate, rejected admissions, evictions and origin load. Cache success should be measured by reduced upstream work and preserved real-user flows, not by the number of entries created.
Turn observability into a reviewable decision
The best dashboard does not merely draw a smoother line. It answers: how many requests arrived, over which interval, from which trusted source, with what share of unknown classification, and which specific protection action can be verified? When a suspected attack overlaps a spike in 404s, show those series separately; a missing page is not itself an attack. When the same event belongs to an observation and a response class, avoid stacking them as though they were disjoint populations. Add a drill-down from an aggregate to the preserved evidence available for that exact slice, plus an honest message when no individual row survives.
Operational confidence also needs tests. Replay known batches and verify the sum of five-minute buckets against raw totals. Exercise a delayed ingest and a job restart to catch duplicate or missing windows. Check that web and native views use the same response and mitigation definitions. Monitor the pipeline itself: last successful raw write, last complete rollup, oldest raw data, error rate, storage free space and query latency. When one store is unavailable, mark the affected cards stale rather than displaying zero. The practical standard is simple: a million in the headline, forty examples in the drawer and a tiny city sample can all be correct, but only if the product makes their relationship obvious.
Every traffic number needs a window, a source, a coverage statement and a freshness time. Keep complete counts separate from saved request examples; never let a small sample masquerade as the whole day.