
Hostwatch under HTTP attack load: measuring detection and scoped mitigation
We measured a deliberately small origin before and during a controlled scan, then applied a verified temporary client rule. The test connects a real capacity limit, Hostwatch detection, Nginx enforcement and ordinary-client responses in one reproducible investigation.

Production repeat: faster archive corroboration and measured Auto enforcement
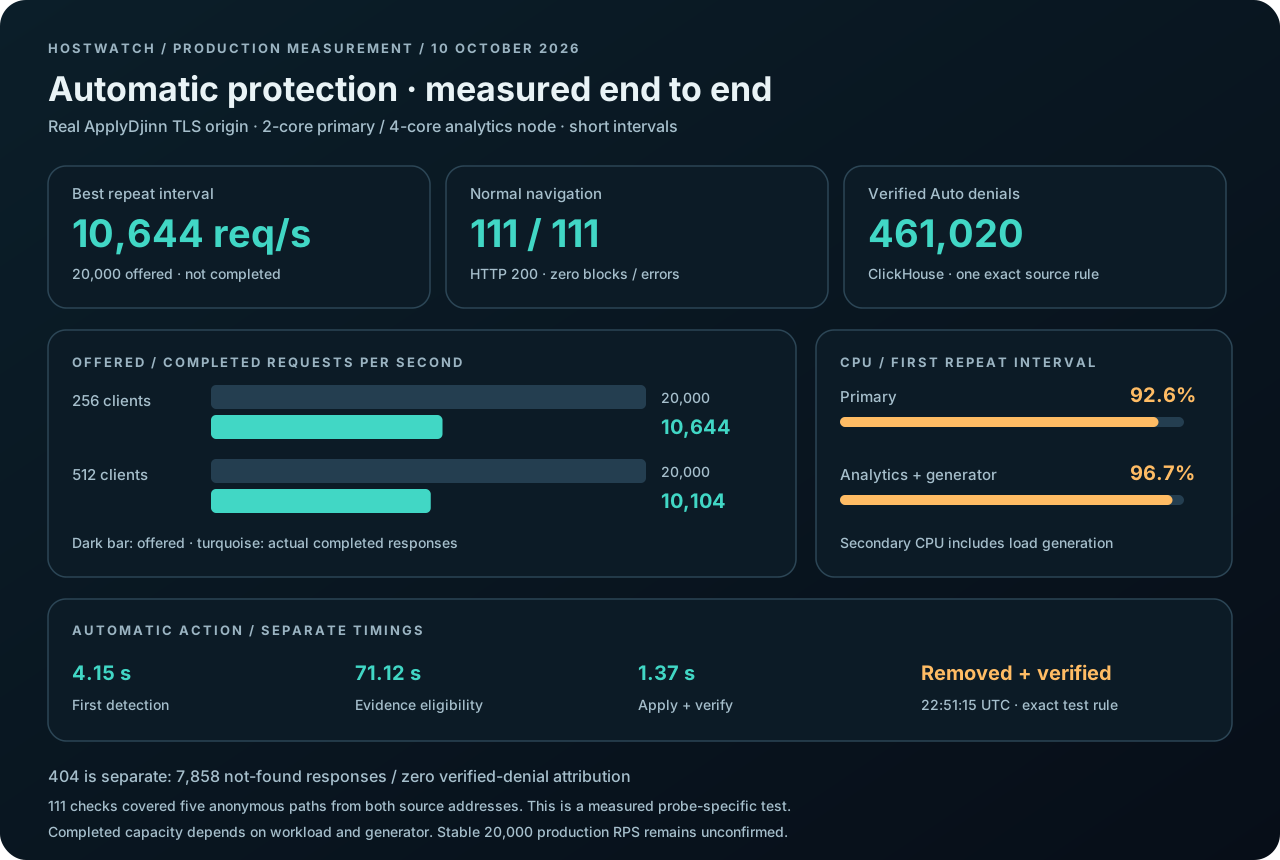
A second production run at 22:45 UTC on 10 October used the same real ApplyDjinn TLS origin after a targeted protection update. The trusted live detector now asks ClickHouse to corroborate exact suspect addresses using two completed twenty-second windows. Each window must contain at least one hundred known URI probes, a probe share of at least ninety percent, and no verified crawler requests. Only already-observed trusted live suspects are queried, with a bounded address list and query timeout. Five-minute classifications continue to provide permanent investigation history. A generic HTTP 404 still does not satisfy the known-probe condition.
The new run first detected the controlled source in 4.15 seconds. Eligibility took a further 71.12 seconds while exact-source live coverage and completed archive windows accumulated. Nginx then applied and verified the automatic temporary action in 1.37 seconds. These are separate measured stages of one automatic decision. No manually applied rule substituted for automatic protection. The action matched known probe paths from the exact source, while ordinary navigation from the same source remained outside that selector. This shorter corroboration path preserves the owner's action envelope, complete-telemetry requirement, expiry and protected-crawler checks.
We also reconciled host traffic-shaper ownership: the legacy per-minute egress writer was disabled after preparing a timed rollback, and Hostwatch restored its existing normal policy of approximately 200 Mbit/s. Two further HTTP/1.1 intervals each offered 20,000 requests per second. With 256 clients, 229,478 responses completed over 21.56 seconds, or 10,644 responses per second. With 512 clients, 226,186 completed over 22.39 seconds, or 10,104 responses per second. Both reported zero transport errors. The first interval averaged 92.6 percent CPU on the primary and 96.7 percent on the analytics node, whose measurement includes the external load generator. Increasing concurrency did not increase completed capacity in these two intervals. The earlier six-phase best of 11,535 responses per second remains in the dated record below.
All 111 ordinary navigation checks selected from these two intervals returned HTTP 200, with zero rate-limit blocks and zero check errors; their combined p95 was 931 milliseconds. Across the independently queried archive window, ClickHouse recorded 461,020 verified HTTP 429 denials associated with this one Auto action. The same window contained 7,858 HTTP 404 responses with zero verified-denial attribution. The exact test contribution was removed and verified at 22:51:15 UTC, and the bounded test processes were stopped. The web console and native protection view expose both production records, including CPU, RAM, offer drops and normal-client latency. These short probe-specific measurements establish the tested envelope; they do not establish stable 20,000 completed production RPS for arbitrary workloads.
Production follow-up: Auto on the real ApplyDjinn TLS origin
We then repeated the validation against ApplyDjinn itself, using its real TLS origin and two external generator addresses. The production primary has two CPU cores and 4 GB of RAM, alongside other active workloads. The secondary has four CPU cores and 8 GB of RAM. During this follow-up the authoritative SQLite business database, mobile reads, a bounded MongoDB catalog cache and public page rendering were moved to the secondary. The gateway still keeps private and authenticated requests on the primary. This is a concrete separation of read rendering and storage from the public edge; MongoDB is a catalog cache here, rather than a replacement for the application's authoritative schema.
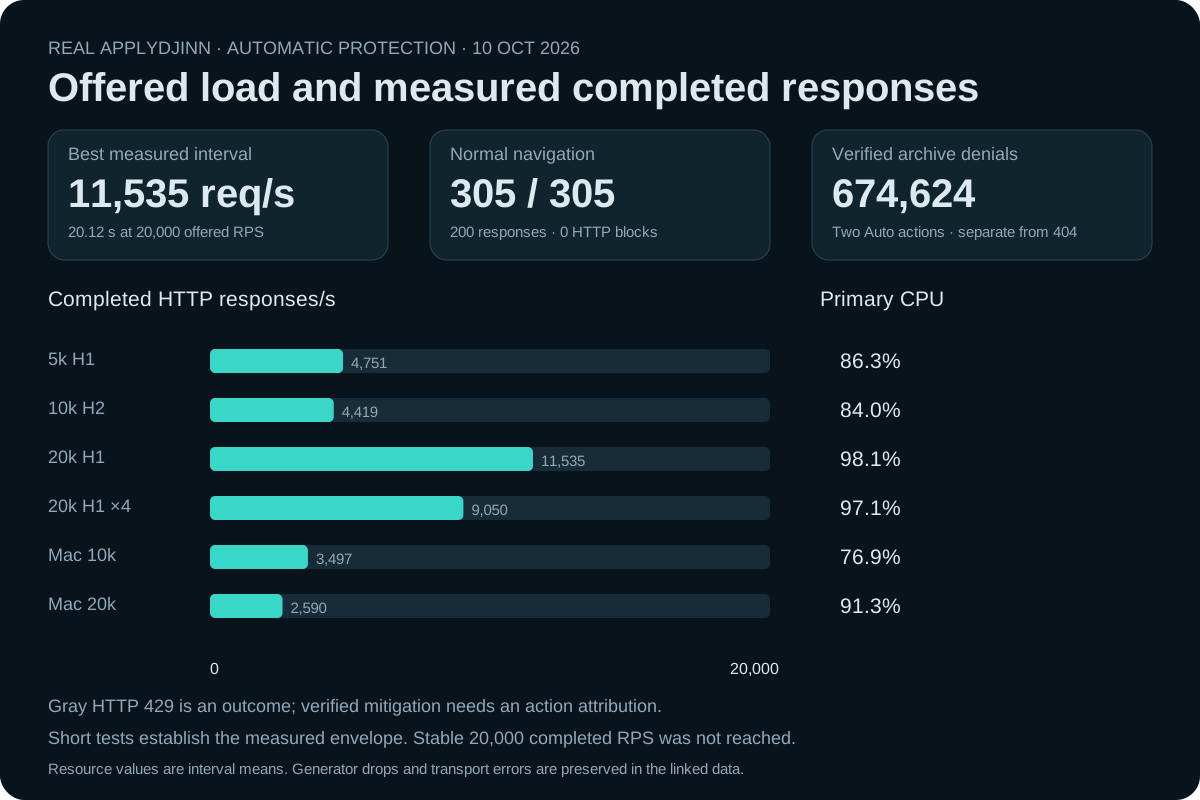
Automatic authority required repeated complete live windows and fresh ClickHouse IP behavior evidence. A new real source was detected 8.52 seconds after its first measured probing interval began. The two closed five-minute history windows required by the policy delayed eligibility by 501.24 seconds after detection. Once eligible, the rule was applied and verified in 1.54 seconds. A repeat test with an already corroborated source verified reapplication in 1.67 seconds. Keeping these three timings separate prevents an application-time number from disguising the time needed to collect evidence. The selected rule matched known probe paths from that particular source; normal routes from the same source did not inherit its probe limit.
At 20,000 offered RPS, the best production interval completed 232,069 responses over 20.12 seconds: 11,535 completed responses per second. Of those, 232,029 were HTTP 429 responses and 40 were admitted HTTP 404 responses. The generator dropped 167,931 offers before dispatch and reported zero transport errors for that interval. Primary CPU averaged 98.1 percent. This is the actual short-interval production envelope for the measured configuration. It is separate from the isolated weak-origin experiment below, which completed approximately 21,000 requests per second. A configured offer rate, an isolated proxy benchmark and a production completed rate answer different questions. Stable 20,000 completed production RPS was not reached in this run.
Five ordinary anonymous navigation paths were requested concurrently from both real generator addresses, including the salary page with valid filters. Across the six selected production intervals, all 305 checks returned HTTP 200, with no HTTP 429 or 444 blocks and no check transport failures. Their combined p95 was 1,251 milliseconds. The result demonstrates the tested navigation paths under this probe-specific mitigation, including clients sharing the generator address. It does not extend automatically to every authenticated workflow or a distributed high-cardinality application attack. The measurement record retains each interval's normal-client counts and latency alongside the attack generator's outcomes.
Protocol and source location changed the offered-to-completed ratio substantially. A four-core secondary generator became CPU-bound during an HTTP/2 interval. Mac-origin high-concurrency intervals produced transport errors while the concurrent normal checks remained successful. We therefore retain queue drops and generator transport errors explicitly. Resource measurements report both hosts; secondary CPU includes the secondary load generator when it was active. Process CPU is expressed as a percentage of one core, while host CPU is the percentage across all host cores. The report excludes the deployment and database cutover intervals so they cannot be mistaken for service behavior under an unchanged configuration.
ClickHouse independently recorded 674,624 verified denials attributable to two automatic actions between 21:20:00 and 21:47:06 UTC. The same window contained 25,675 HTTP 404 responses with zero verified-denial attribution. These counts make the distinction operationally visible: a gray observed HTTP rate-limit outcome is not the same data as an amber verified action, and a blue not-found response is not rewritten as successful protection. At the end of the follow-up, the test-created restrictions were removed through the typed undo path and removal was verified at 21:47:05 UTC. The dashboard and native protection screen expose the dated measurement record, rather than treating a historical benchmark as live health.
A test small enough to expose a real bottleneck
Our test origin was a separate Go HTTP service restricted to a quarter of one CPU and 128 MiB of memory on an ARM64 server. A successful application request performed a fixed SHA-256 workload. Four processing slots bounded in-flight work; requests arriving after those slots filled received an explicit fixture capacity response. Nginx ran in its own isolated loopback configuration in front of this origin. The Hostwatch production detector engine consumed actual Nginx JSON records, and the production typed mitigation executor generated and verified the temporary protection. The origin, proxy and test controller were separate from the server's working databases.
This arrangement makes the experiment useful for a small application operator. The origin is intentionally easy to exhaust, so relief at the edge becomes measurable without placing a production application at risk. The generator sent ordinary work requests from one fixture client and the controlled scan from another. Those identities were supplied only by an isolated, trusted loopback test proxy; the fixture header was never exposed as a public identity source. We retained the request totals, response codes, latency distributions, generator drops and protection state. Resource quotas and short test durations kept the experiment bounded and repeatable.
First measure the origin, with protection absent
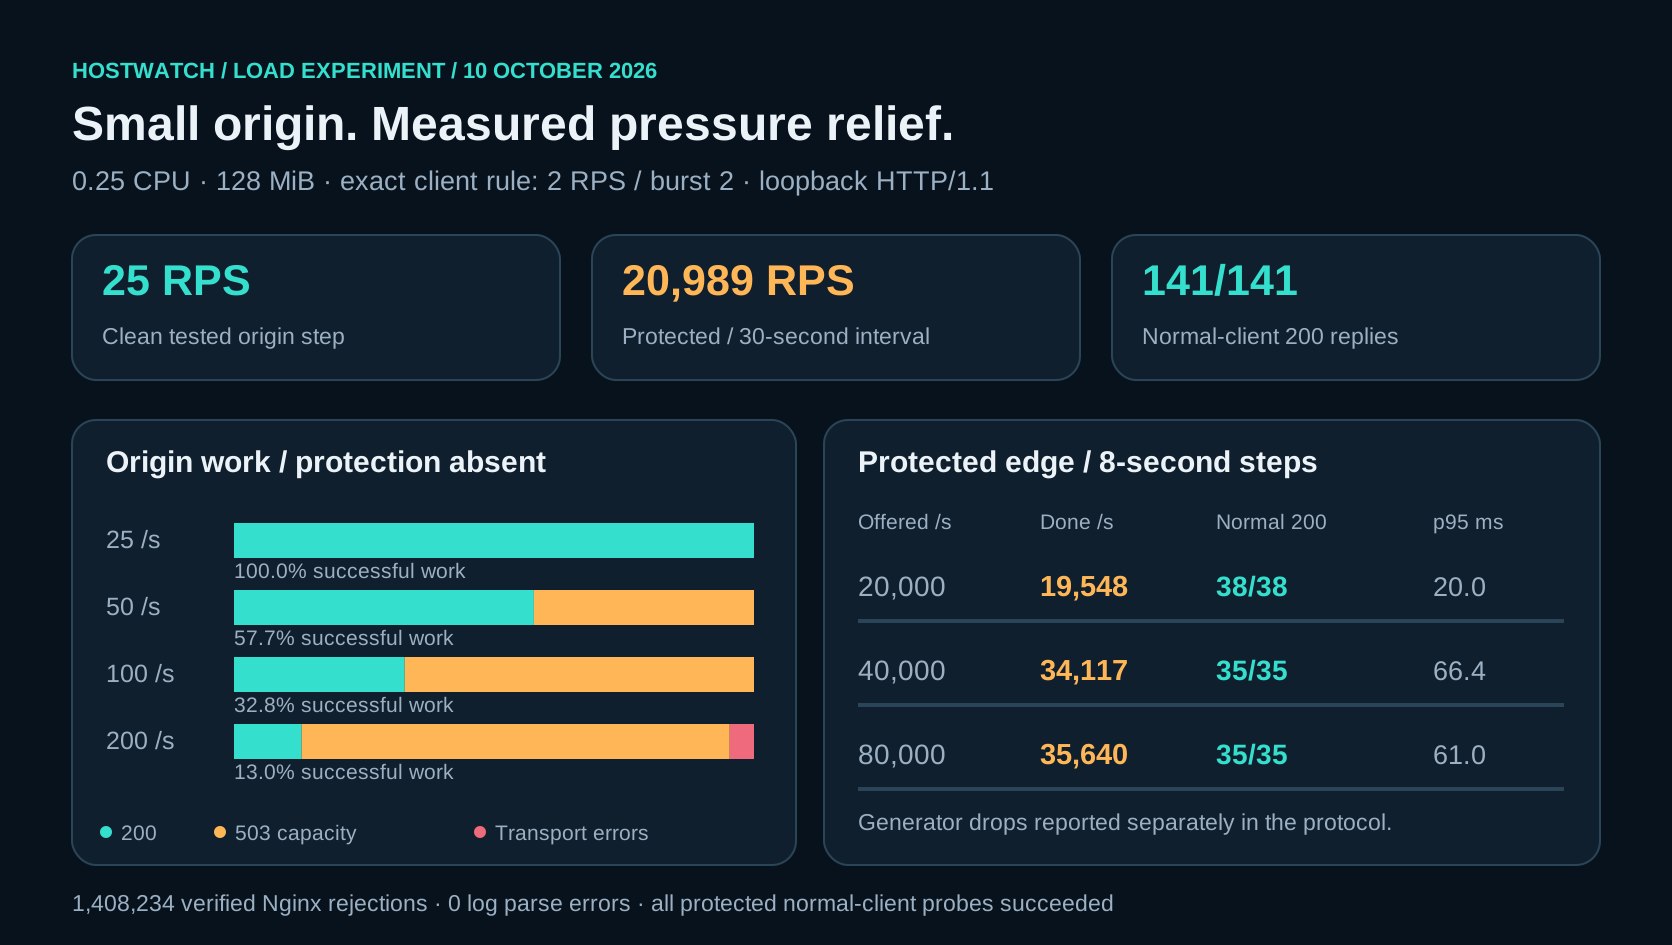
We began with a quiet baseline and then offered 25, 50, 100 and 200 work requests per second in six-second steps. At the 25-RPS step, all 150 main requests returned 200, with a measured p95 of 16.5 milliseconds. The concurrent normal client also completed all twenty-nine requests successfully. At 50 offered RPS, 173 of 300 main requests returned 200 and 127 reached the fixture's 503 capacity response. This brackets the clean tested workload between those steps. The figure is an observed envelope for this exact CPU workload and quota, rather than a universal throughput number for Go or Nginx.
Continuing the bounded overload steps exposed the cost of admitting excess work. At 100 offered RPS, the main stream's p95 was 484.5 milliseconds; at 200 offered RPS, it approached the one-second client timeout. The normal client's success rate declined during the same intervals. This matters because a throughput counter can include quickly rejected requests and still look impressive. We keep successful application work, explicit capacity responses and transport errors distinct. The purpose of the baseline is to identify the first workload-sensitive bottleneck, then choose a protection whose admitted work leaves room for the normal client.
Create a recognizable scan, then watch the detector
The attack fixture repeatedly requested an environment-secret path through the weak origin. A production website should avoid making this path perform expensive rendering; here it was intentionally routed through the same fixed-cost fallback to model a scan that consumes application work. Hostwatch classified the path using its existing request-signature matcher. It did not declare an attack simply because the result was 404. The observed behavior combined the sensitive-path pattern, repetition from one trusted source, a complete log window and concurrent service degradation. Ordinary work requests continued from a different client during the scan.
The unprotected 200-RPS scan sent 13,999 requests over its seventy-second offered interval. Of those, 11,654 returned the fixture's capacity response and 324 hit transport errors; the normal client completed only sixty successful responses. The detector produced the repeated-probing finding, marked it as suspected abuse and attached the observed service degradation. The first finding appeared 10.59 seconds after the first observed scan request, and the incident became active at 20.59 seconds after two distinct closed buckets confirmed the behavior. We saved both the first observed scan timestamp and the incident events, so the detection timing can be reviewed independently of the time at which an operator applies a rule. Closed-window evaluation also makes the decision's observation period explicit.
Keep behavior, HTTP outcomes and enforcement distinct
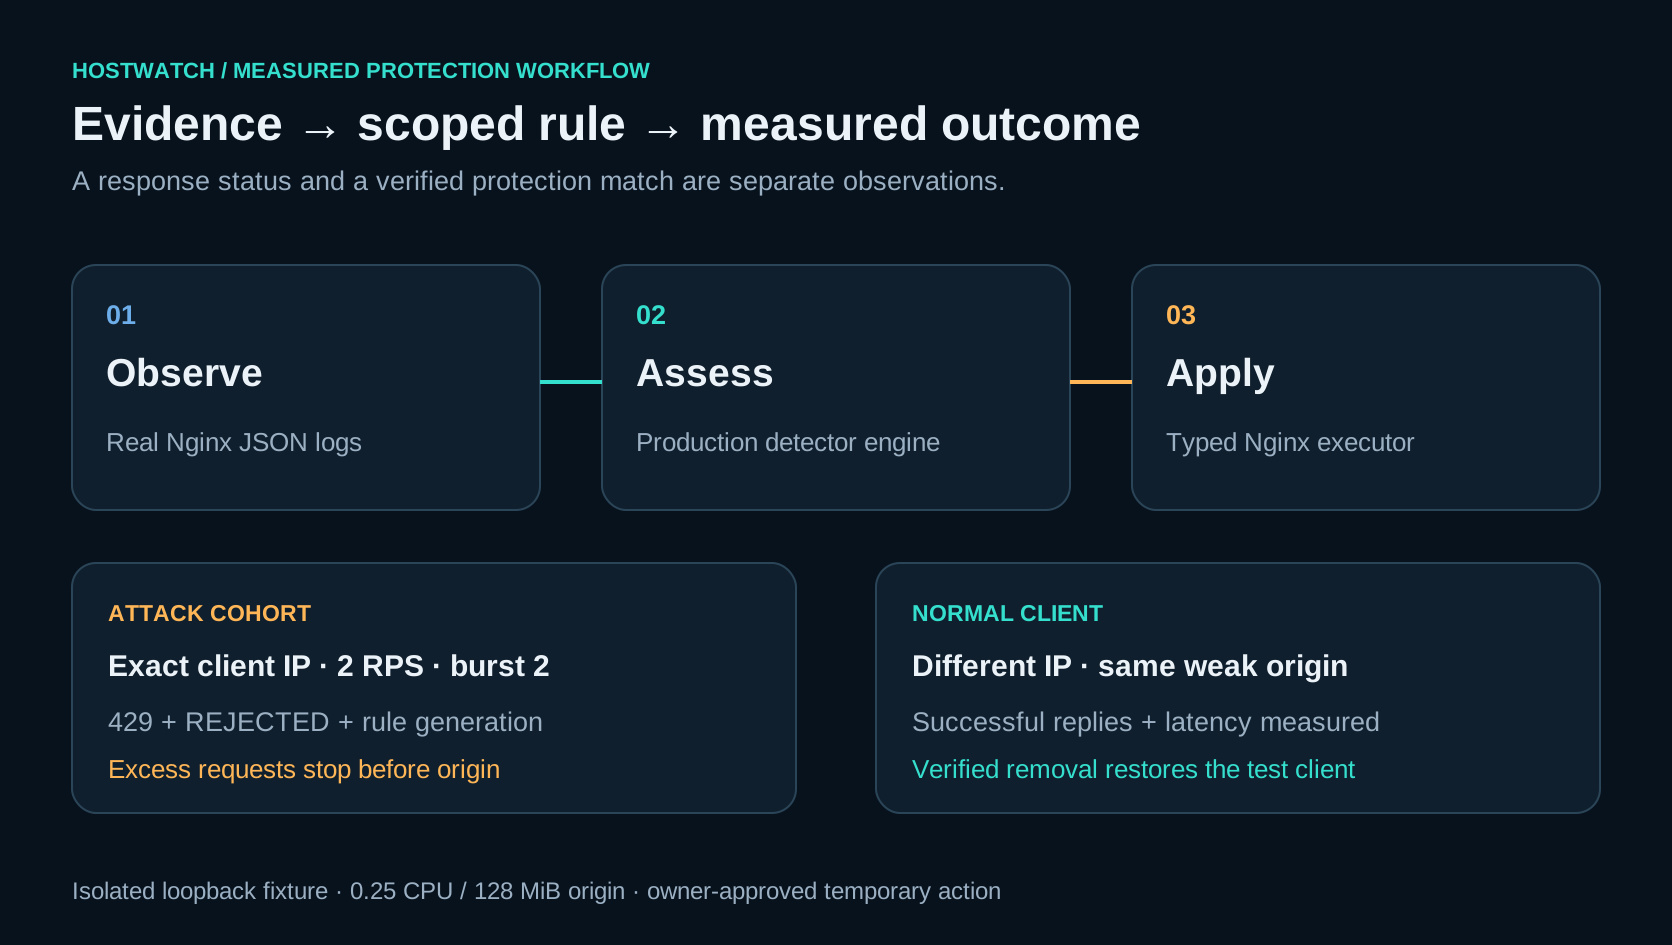
An attack assessment describes a behavior and its evidence. An HTTP status describes a response. A protection action describes an installed, scoped control. These are three related records with different meanings. Our fixture's missing secret-path response remained a 404 application outcome; the detector's probe classification was stored separately. Its overload response was a deliberate 503 from the fixture, with a different interpretation from an upstream gateway failure. Once Nginx enforced the temporary request limiter, its 429 responses and REJECTED limiter state established that excess requests matched the active limiter before reaching the origin.
This separation is the basis for useful attack infographics. Show suspected traffic, verified rule matches, admitted requests and application errors as separate quantities over a fixed window. Do not recolor every 404 as an attack or every 429 as a successful defense. The operator should be able to move from a chart segment to the selected client, route, incident reasons and action record. Complete selected-window counters describe scale; saved examples explain individual requests. Hostwatch's traffic history guide explains how durable evidence and aggregates support this investigation without pretending that a short recent sample is the full distribution.
Apply a temporary rule to the measured source
For this run, the approved action was a temporary client limit of two requests per second with a burst of two. It selected the exact test client on the fixture site and had a 180-second lifetime. It did not place every visitor into one shared bucket. The typed executor generated the Nginx configuration, checked its syntax, reloaded the isolated worker and verified the active generation through the local protection-state probe. The final measured apply-and-verify call took 1,068.9 milliseconds. The retained action record includes its policy revision, immutable plan hash and verified state, giving the response measurements an explicit control to correlate with.
The exercise used the owner-approved application path after the detector had gathered the required exact-source evidence. That authority is recorded as manual. Hostwatch's automatic client actions use their own delegation and fresh archived-behavior gates; this experiment's successful manual action should be read as the measured detector-to-approved-mitigator path. Such precision makes the result reproducible. The immediate question is whether this specific installed control rejects the intended excess traffic, reduces work entering the small origin and preserves the concurrent client's normal responses. Those outcomes can be measured directly rather than inferred from the presence of a policy toggle.
Increase attack pressure with the rule active
After verification, we increased the offered scan load in steps and kept the normal client requesting the same weak origin. At 20,000 offered RPS, all 160,000 dispatched requests completed without transport errors or generator drops; 159,984 matched the limiter. A separate thirty-second run at 21,000 offered RPS completed 630,000 requests at 20,989 measured RPS. Its normal client received 141 of 141 successful responses, with a p95 of 20.4 milliseconds. The higher load exercised the edge rejection path while the origin's admitted attack rate remained constrained by the two-RPS rule. Read the recorded completed RPS beside the offered rate and generator drops: a load generator's configured rate is an intention, while server records and completed requests describe what actually happened. The fixture includes an explicit drop counter so a generator limit cannot quietly become a claimed server capacity result.
At the largest eight-second offered step of 80,000 RPS, the combined fixture completed 289,308 requests at 35,640 RPS. It explicitly counted 350,692 generator drops, and the normal client completed all thirty-five requests with a p95 of 61.0 milliseconds. This is the measured plateau of the local generator, proxy and observer sharing this four-CPU host. At every protected step we counted responses by producing outcome and recorded the normal client's success count and p95 latency. This is the practical success criterion for an address-specific limiter. The system should return a predictable rejection to the selected excess stream while the ordinary client retains useful service. The experiment therefore measures both pressure relief and user access. A high rejection rate alone would be insufficient evidence if normal-client requests also failed; the paired measurements establish what the rule accomplished for this fixed workload and network path.
Explain why a rate limit is present
A rate limit is an admission policy, and the interface should explain its purpose. A standing product quota, a crawler allowance and a temporary attack response may all issue 429 while having different owners and reasons. In this case, the temporary action existed because repeated secret-path probes from the selected source coincided with degradation of the limited origin. The incident supplied the behavior evidence; the policy supplied the permitted rate, burst, scope and lifetime. The action record supplied the verified application. Keeping that chain visible lets an operator answer why a particular client was limited without guessing from a response histogram.
For routine operations, display the rule's scope next to its matches: exact client, site, path selector, configured budget, creation time and expiry. Show successful normal-client work alongside those matches. If a rule is site-wide, say so and make its effect on shared admission visible. A provider or country may help group observed behavior, but the chart should retain the underlying client and route evidence. Protection should follow an explicit policy rather than a colorful ranking alone. The 429 and 502 guide connects these distinctions to the proxy and application logs an operator actually reviews.
Combine admission control with bounded caching
The fixture deliberately performed origin work for every admitted request so the rate limiter's effect could be measured clearly. A public application also benefits from caching routes whose responses are safe to share. Repeated anonymous reads of a canonical page can be served without repeated rendering or database work. Cache admission should be restricted to reviewed read-only routes, bounded response sizes and meaningful key parameters. A scan that varies every URL or query value should not allocate unlimited entries simply because it arrived quickly. Limit cardinality and origin miss concurrency while preserving useful hot entries.
Redis or Valkey can provide the cache store, but its capacity and freshness policy still need measurement. Observe hit ratio, memory use, evictions, miss rate and actual origin work. A bounded sliding freshness extension may serve repeated reads, while an absolute age limit preserves a predictable content-update boundary. Keep session-dependent responses and writes outside shared caching. During an incident, show cache hits and verified mitigation matches separately: a cached successful read was served, while a denied request was not admitted. That distinction helps explain why an application survives a repeated-page burst and how its behavior changes under a high-cardinality scan.
Give the evidence pipeline its own capacity budget
Traffic evidence is part of the tested system. Per-request observations feed bounded live counters; durable request history and periodic aggregates support deeper investigation. Hostwatch uses ClickHouse for sanitized request evidence and MongoDB for grouped historic views in this deployment, with distinct retention policies. The operator should see ingest freshness and coverage beside a selected time window. A five-minute aggregate can describe a complete historic grouping, while the per-second display describes the current interval. Both are useful when their scope is explicit. Raw client addresses and private request details belong in the authorized account view, not in a public benchmark article.
For this experiment we retained actual proxy logs and exported a sanitized measurement record containing the environment, offered and completed counts, normal-client outcomes, detector timing and verification results. Nginx recorded 1,408,234 REJECTED limiter matches across the protected phases. The observer processed 1,423,224 records with zero JSON parse errors and a peak measured ingestion lag of 123 milliseconds. A separate single-CPU microbenchmark measured 762.8 nanoseconds per Observe call, about 1.31 million observations per second; that hot-path measurement excludes log parsing, I/O, closed-window evaluation and rule application. This makes the public infographics auditable without publishing operator credentials or real visitor identifiers. The same habit helps after a production incident: keep exact totals, reason codes, rule state and enough bounded examples to explain the response. A monitoring pipeline should preserve the information needed to review a decision while keeping its own memory, write volume and queue growth under observation.
Finish by measuring removal and restored access
A temporary defense is complete only when its lifecycle is observable. After the protected pressure steps, we requested removal through Hostwatch's undo path and checked the resulting Nginx generation. The undo operation returned removed_verified and the subsequent status contained zero active actions. The formerly limited fixture client then completed fifteen of fifteen work requests successfully, while the normal client also completed fifteen of fifteen. The test then stopped the isolated load units and proxy, leaving the normal Hostwatch agent and database services active. Its resource limits, short execution bounds and loopback listener made cleanup straightforward. The action and result records remain available in the sanitized research attachment so the reported measurements can be reviewed without requiring the test to stay running.
For your own application, repeat the experiment with its real workload cost and acceptable latency budget. Establish a clean baseline, find the capacity knee, introduce an identifiable controlled behavior, inspect the detector evidence, approve a narrow expiring rule and measure both matched traffic and a normal client. Increase load until the first observed limiter or generator boundary is clear. Then verify rollback. Hostwatch's value in this workflow is the connection between host health, request behavior and an accountable action. The result is a measured protection decision that an operator can explain, reproduce and remove when the episode ends.
Measure the origin limit, detect a behavior with fresh evidence, apply a narrow expiring action, and verify normal-client responses alongside rule matches. Report observed throughput and generator limits separately; finish by verifying removal.