
Set the investigation scope
Choose the node, site and time window in the top filter. Drill into an interval, country, caller group or IP to inspect the evidence that remains for that scope. Aggregate totals and retained individual examples have different coverage.
Distinguish identity from behavior
Verified crawlers, unverified bot claims, scanners, suspected pressure and other clients are different signals. A User-Agent string alone does not verify a crawler. An external IP alone does not identify abuse.
Known service networks, paired devices and verified accounts are separate proofs. A paired room key does not establish a subscription. Shared IPs do not authenticate every request from that address.
Follow traffic into a service and its upstream
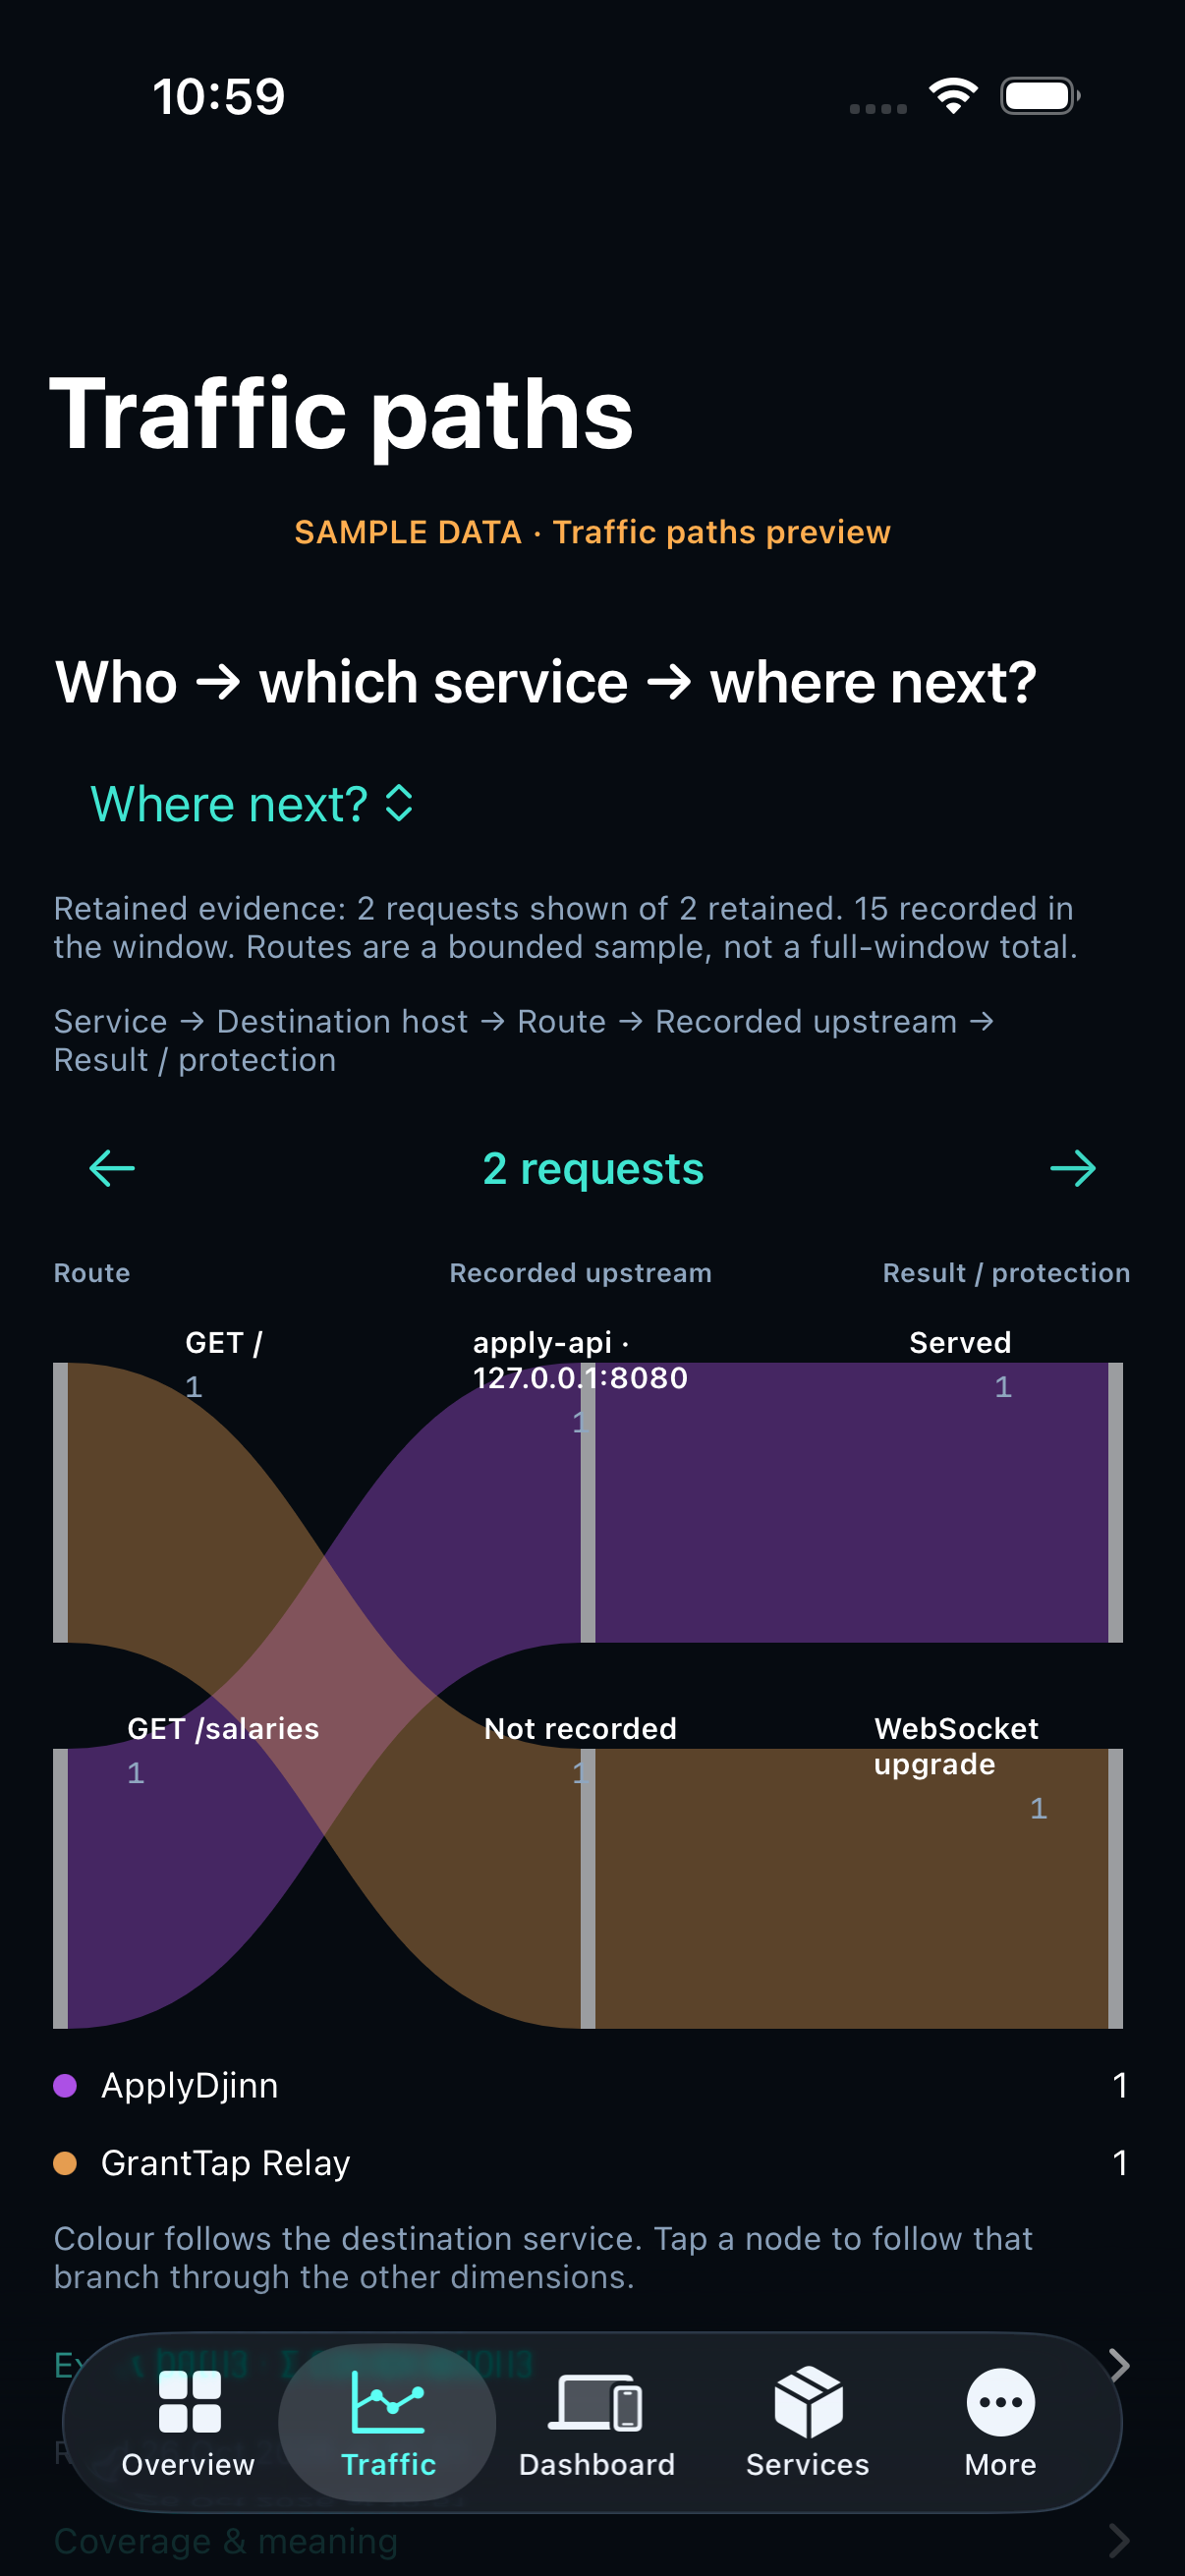
Open Traffic → Who → which service → where next? Traffic → services connects own/external origin, caller type, destination service and result using recorded joint counters. Choose ApplyDjinn, GrantTap or any destination legend to follow that branch. Arrows move between three readable columns; the app does not require a sideways drag.
Choose Where next? to inspect service → host → method/path → upstream → result. App clients adds the trusted recorded identity category; Countries adds the request-time country. Exact paths shows full labels and counts. Inspection pauses updates until Resume.
The route views use bounded retained completed requests. Their coverage is shown separately from all requests in the window. Missing upstream stays Not recorded. A WebSocket upgrade counts once; messages and later database calls are not inferred. Confirmed mitigation remains separate from policy limits and HTTP errors.
See live attacks, types and mitigation
Open Traffic → Attack activity & response. Now shows fresh active, watching and recovering findings; Selected window shows historical episodes. Scanner probes, URL enumeration, distributed URL floods and dynamic-route floods have separate groups with evidence descriptions. Crawler and application capacity observations remain separate; intent is not established from a rate spike.
The Sankey connects family → attack type → service → route → response using finding counts. The HTTP heatmap shows maximum sampled RPS with Auto, 1/5/15/60-minute splits; blanks mean no sample. SYN, UDP and ICMP have separate node-wide IPv4 kernel signal cards with scope, freshness and response recommendations. Source distribution needs provider flow evidence.
Open a group for services, routes and retained findings, then inspect a finding for detector evidence. Suggested mitigation is shown separately from applied, verified actions and measured service outcomes. Recorded blockers explain why automatic action was withheld.
Counts are retained findings last observed in the selected interval, not unique campaigns. Latest detector samples can overlap and are not summed. Per-type rejected requests remain unknown when durable rule attribution is unavailable. A 429/444 or account/device allowance limit alone does not prove an attack.
Read outcomes separately
Mitigation requires recorded protection-rule evidence. Nginx and application limits are separate policy outcomes. Unattributed 429 or 444 responses do not prove a Hostwatch denial.
The Errors view excludes attributed protection outcomes from ordinary failures and labels mitigation-related responses when inspected. A request spike is a signal to investigate, not sufficient evidence of an attack.
Inspect IP coverage
Top IPs groups retained checks and current connections by address. Use verified account proof to inspect authenticated activity.
When earlier checks were counted without saved addresses, their distinct IP count is unknown. The app shows collection start time and newer address records. It does not reconstruct old identities from a current connection.