
A CPU limit is not a percentage: reading the cgroup v2 shift
A service can become slow while the host still looks comfortable. Kubernetes’ migration guidance is a good reason to inspect the effective boundary around a workload, not just its dashboard percentage.
Published 26 October 2026. Independent news analysis; source announcements are dated in the article.
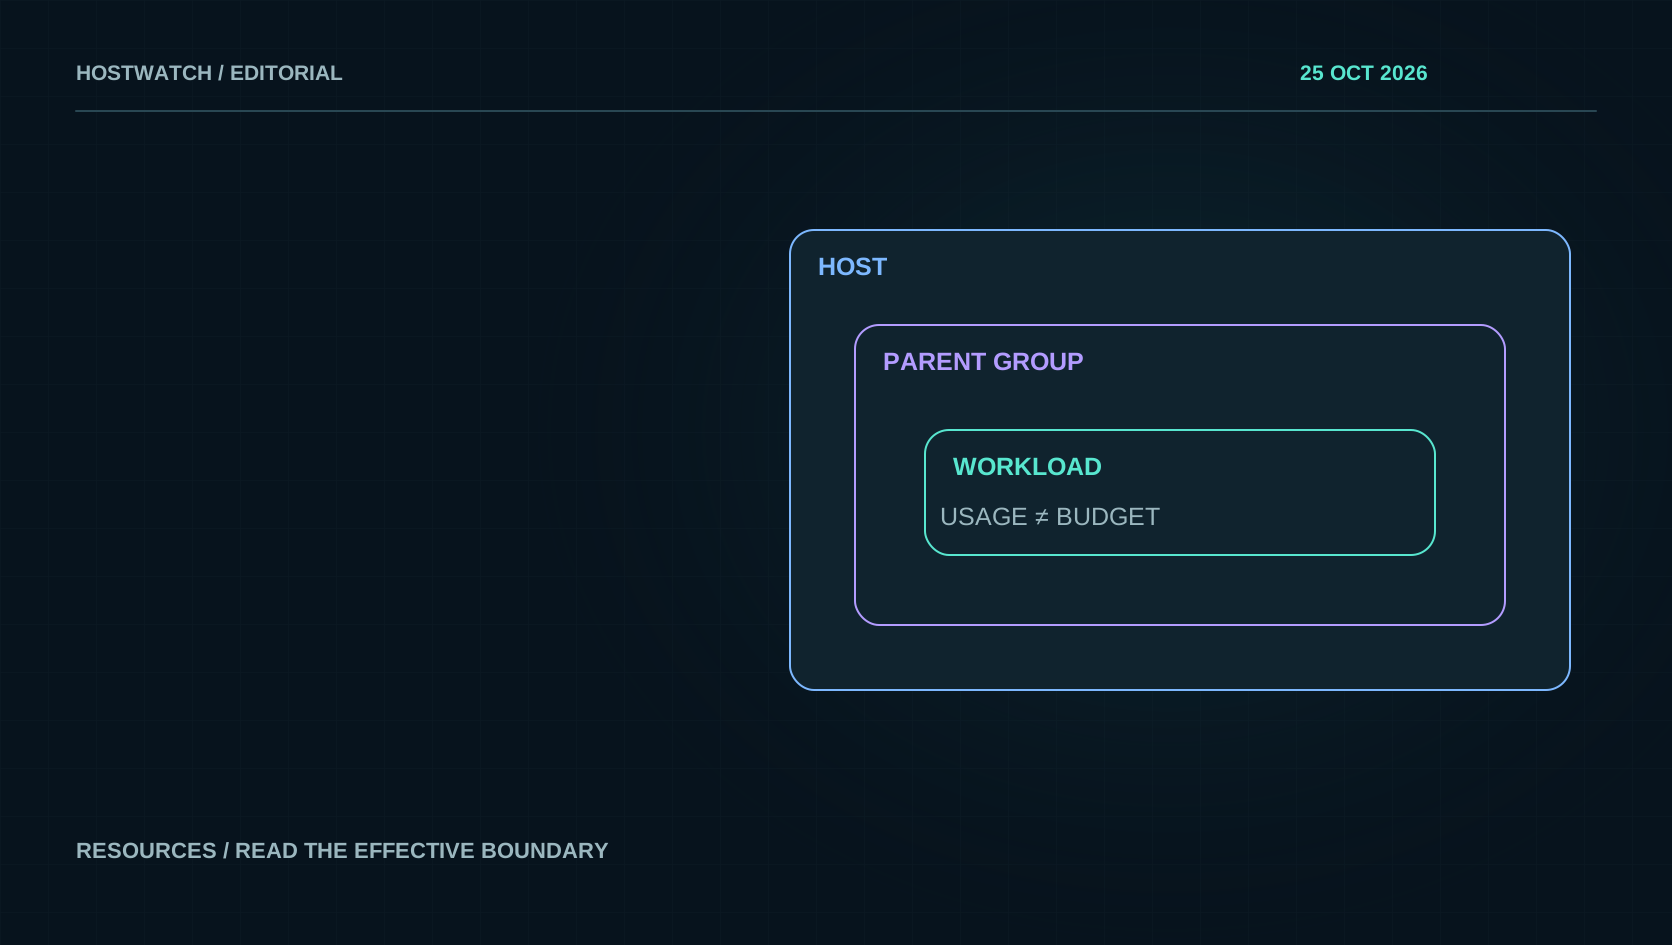
What the October guidance puts back on the checklist
The Kubernetes article published on 6 October reviews the move from cgroup v1 to v2 and the need to align the operating system, container runtime and kubelet. It notes that cgroup v2 support has been stable since Kubernetes 1.25, while newer releases tighten the default treatment of v1 nodes. This is a migration review, not evidence that a particular server already uses the newer hierarchy. Check the guidance for the exact Kubernetes release you operate before planning a node upgrade.
The broader operational lesson applies beyond Kubernetes: resource configuration passes through several layers before the kernel enforces it. A dashboard can read one layer while an operator edits another. The discussion below is our diagnostic approach to that mismatch. It does not announce a Hostwatch Kubernetes controller, automatic node migration or new pressure metrics in every installation. The first task is to establish which hierarchy, runtime and collection path are actually present on the machine under investigation.
Keep intent, enforcement and observation apart
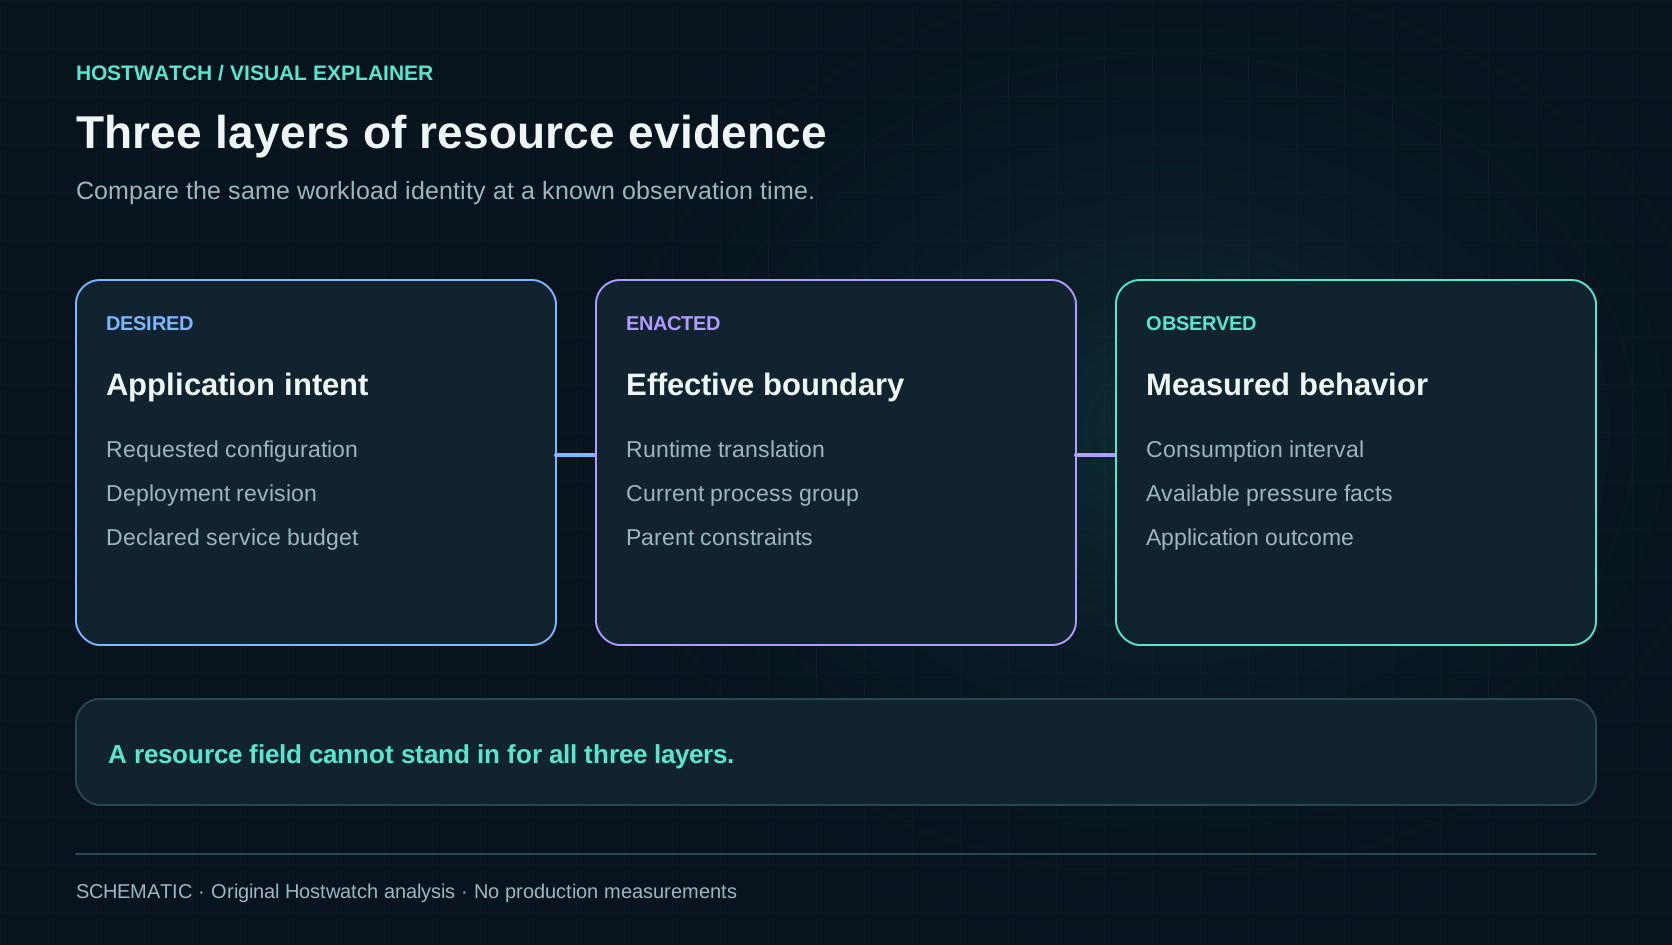
Consider an illustrative API service whose deployment declares a resource budget. The desired setting belongs to the application definition. The runtime translates that setting into a process group and its effective controls. The monitoring agent then reports consumption over a particular interval. These observations can disagree during an incomplete rollout, a runtime change or a collection failure. Write down the scope of each value instead of treating the most convenient one as authoritative. An absent observed limit should remain unknown until it is inspected.
The kernel’s cgroup v2 documentation defines a unified hierarchy with controls that can restrict descendants. A CPU weight is relative scheduling priority under contention; a CPU quota is a time budget. Memory protection, throttling and hard limits also have different meanings. Those distinctions are enough to explain why one “resources” field cannot describe all enforcement. Inspect the relevant boundary and its parent, rather than copying a value from an unrelated process group with a similar name.
Ask what 100 percent means before comparing charts
CPU charts can describe a whole machine, one logical CPU, a container’s configured budget or a workload’s share of a sampled total. The same process can therefore have different percentages in different views without either view being arithmetically wrong. A comparison becomes useful only when the unit and denominator are known. Ask whether a value is an instantaneous sample, an interval average or accumulated CPU time. Keep CPU consumption separate from load and from the fraction of a quota already used.
For example, imagine a service deliberately constrained to a small CPU budget on a larger host. It can reach that boundary while the host-wide chart remains low. Conversely, a high host average can be driven by another workload or by activity outside the containers in view. Neither example establishes the cause of a real slowdown; both show why a single percentage is insufficient. Put the effective service budget, host headroom and application latency in the same time window before deciding whether a resource change would help.
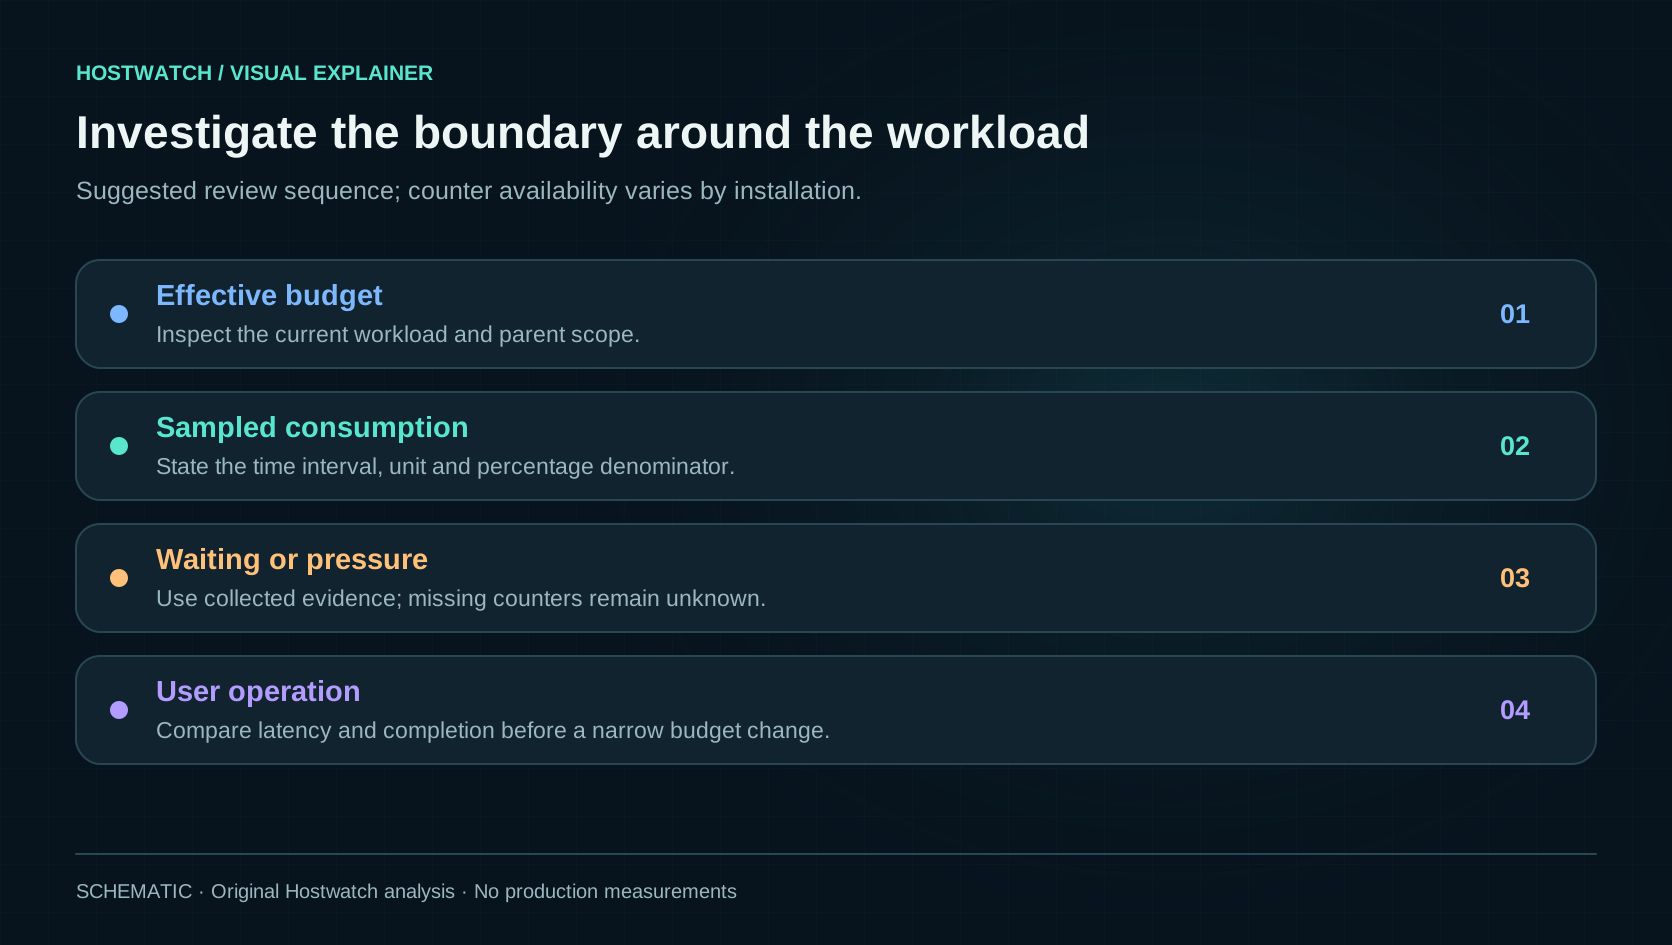
A useful comparison can be very small. Choose one reproducible application operation and record its service identity, effective budget, sample interval, completion time and relevant dependency result. Repeat it under the reviewed configuration without changing unrelated workloads deliberately. This will not create a universal performance benchmark, but it can test a narrow explanation. If the operation slows while its service remains far below the observed budget, the investigation should continue into waiting and dependencies. If the budget is repeatedly reached, inspect the available enforcement evidence before assuming that more host capacity is the only solution.
Consumption and waiting answer different questions
A service can spend time waiting while consuming little CPU. It may wait for storage, another process, a lock or a remote dependency. A consumption chart shows work accounted during its interval; it does not directly explain time when useful work could not proceed. Where pressure or throttling observations are available, use them as an additional dimension and preserve their scope. A host-wide signal is context for the application, not automatic attribution to one container. Missing pressure collection must not become a displayed zero.
The kernel PSI documentation describes pressure as time in which tasks stall on CPU, memory or I/O resources, with separate reporting forms. Our suggested investigation is to compare that evidence with a recognizable slow operation and its dependency timings. If the necessary counters are unavailable, record the gap and use a bounded direct inspection. Do not label every high-memory snapshot an out-of-memory incident, or every slow request CPU throttling. A plausible mechanism still needs an observation tied to the affected workload.
Treat collector compatibility as part of a runtime change
Changing a runtime or resource hierarchy can alter the path by which an agent finds a workload, the meaning of a reported field or the set of counters it can read. A safe review includes one known workload whose identity and budget are easy to verify. Check that it appears once, under the correct service and server, with a credible sample time. Compare startup and steady-state observations. This is a suggested acceptance procedure, not a claim that any particular collector has a known defect.
Also compare the metric before and after aggregation. A five-minute mean can obscure brief peaks; a raw peak can exaggerate how long the load persisted. Keep both with their own labels. A missing collection interval should remain a gap rather than a smooth line inferred between two surviving points. If the agent can no longer observe an effective limit, explain that loss before allowing the interface to imply that a newly configured setting is working. Runtime compatibility includes the operator’s evidence path, not just whether the application starts.
Change the narrowest budget supported by the evidence
When evidence points to a service boundary, make a controlled change with an expected result and a return path. Specify which workload, which limit and which observation window will be compared. Account for neighboring workloads and the machine’s remaining headroom. Increasing every budget at once can remove the information needed to distinguish the cause, and it can move pressure to a shared database or storage device. A successful change should improve the relevant user operation while keeping the rest of the host usable. Record a rollback condition before the change and compare the same workload identity afterward.
Finish with an explicit outcome: the new setting was observed, the intended operation improved or did not improve, and particular uncertainties remain. If a deployment definition changed but enforcement did not, repair the application-to-runtime path. If enforcement changed but the operation is still slow, continue into dependencies rather than repeating the same adjustment. Kubernetes’ cgroup v2 guidance is valuable because it makes these layers visible. The lasting benefit is a resource conversation grounded in effective boundaries and measured behavior, instead of percentages with undocumented denominators.
Read desired resources, enacted limits, measured consumption and pressure as separate evidence. Check the running hierarchy and the metric’s denominator before increasing a limit or blaming the host.